Generative Art with CNC
19th Aug 2023
Making Things CNC Art Machine LearningThe world of generative art might seem like a strange one and that is largely because it is. While what we are going to see here isn't as incredible (or weird, depending on your point of view) as what systems like DALL-E or Stable Diffusion can produce, I want to highlight how basic ML techniques can be used in a creative way to make some simple and satisfying art pieces.
The TL;DR
I leveraged a basic polynomial regression system I had previously written about and published freely (this system is all written from scratch in GO by me because I secretly hate myself) to generate some fun CNC engraved art pieces based on a really simple user input. The basic flow is the user clicks around a blank canvas to generate a point cloud, the algorithm fits a polynomial curve to it, then another algorithm generates CNC G-Code which my DIY CNC machine can then engrave into thin plywood making little unique decorative art pieces. I made a YouTube video about it also if you want to check it out!
User Interaction
When I was first thinking about this project I was quickly confronted with the challenge of generating data to test my model against. I was testing using data files that I would generate from Excel using some pseudo random algorithms. This was fine, but the issue I was running into was that the data was either too uniform or two random, neither of which gives a compelling, or dare I say artistic, looking curve to the model outputs. With this in mind I was trying to figure out a simple way of quickly generating and testing datasets, visualising the model results and iterating on the whole system at speed.
One of the big things slowing me down was the limits of the interaction with the old code I was using. Remember, because I hate myself, I am using the old hand crafted ML pipeline I had built using GO. This was a command line utility that took files as input and equally dumped out files as outputs. Not exactly quick to work with for making visualisations and switching between spreadsheets to generate test data and view outputs. This was where the first brainwave came about. Why don't I take the core code from the old pipeline and integrate it into a new GO web app that could not only do the modelling but could also host a simple web UI and http server to handle the interactions. So that is exactly what I did!
The UI for this is very simple and written in pure HTML and JavaScript. The backend is equally as simple using GO's amazing and simple http server which I am using to handle serving static files and a single JSON endpoint. You can see all this code here (I wouldn't recommend you copy any of these patterns as it's all thrown together, but feel free to poke at it if you like).
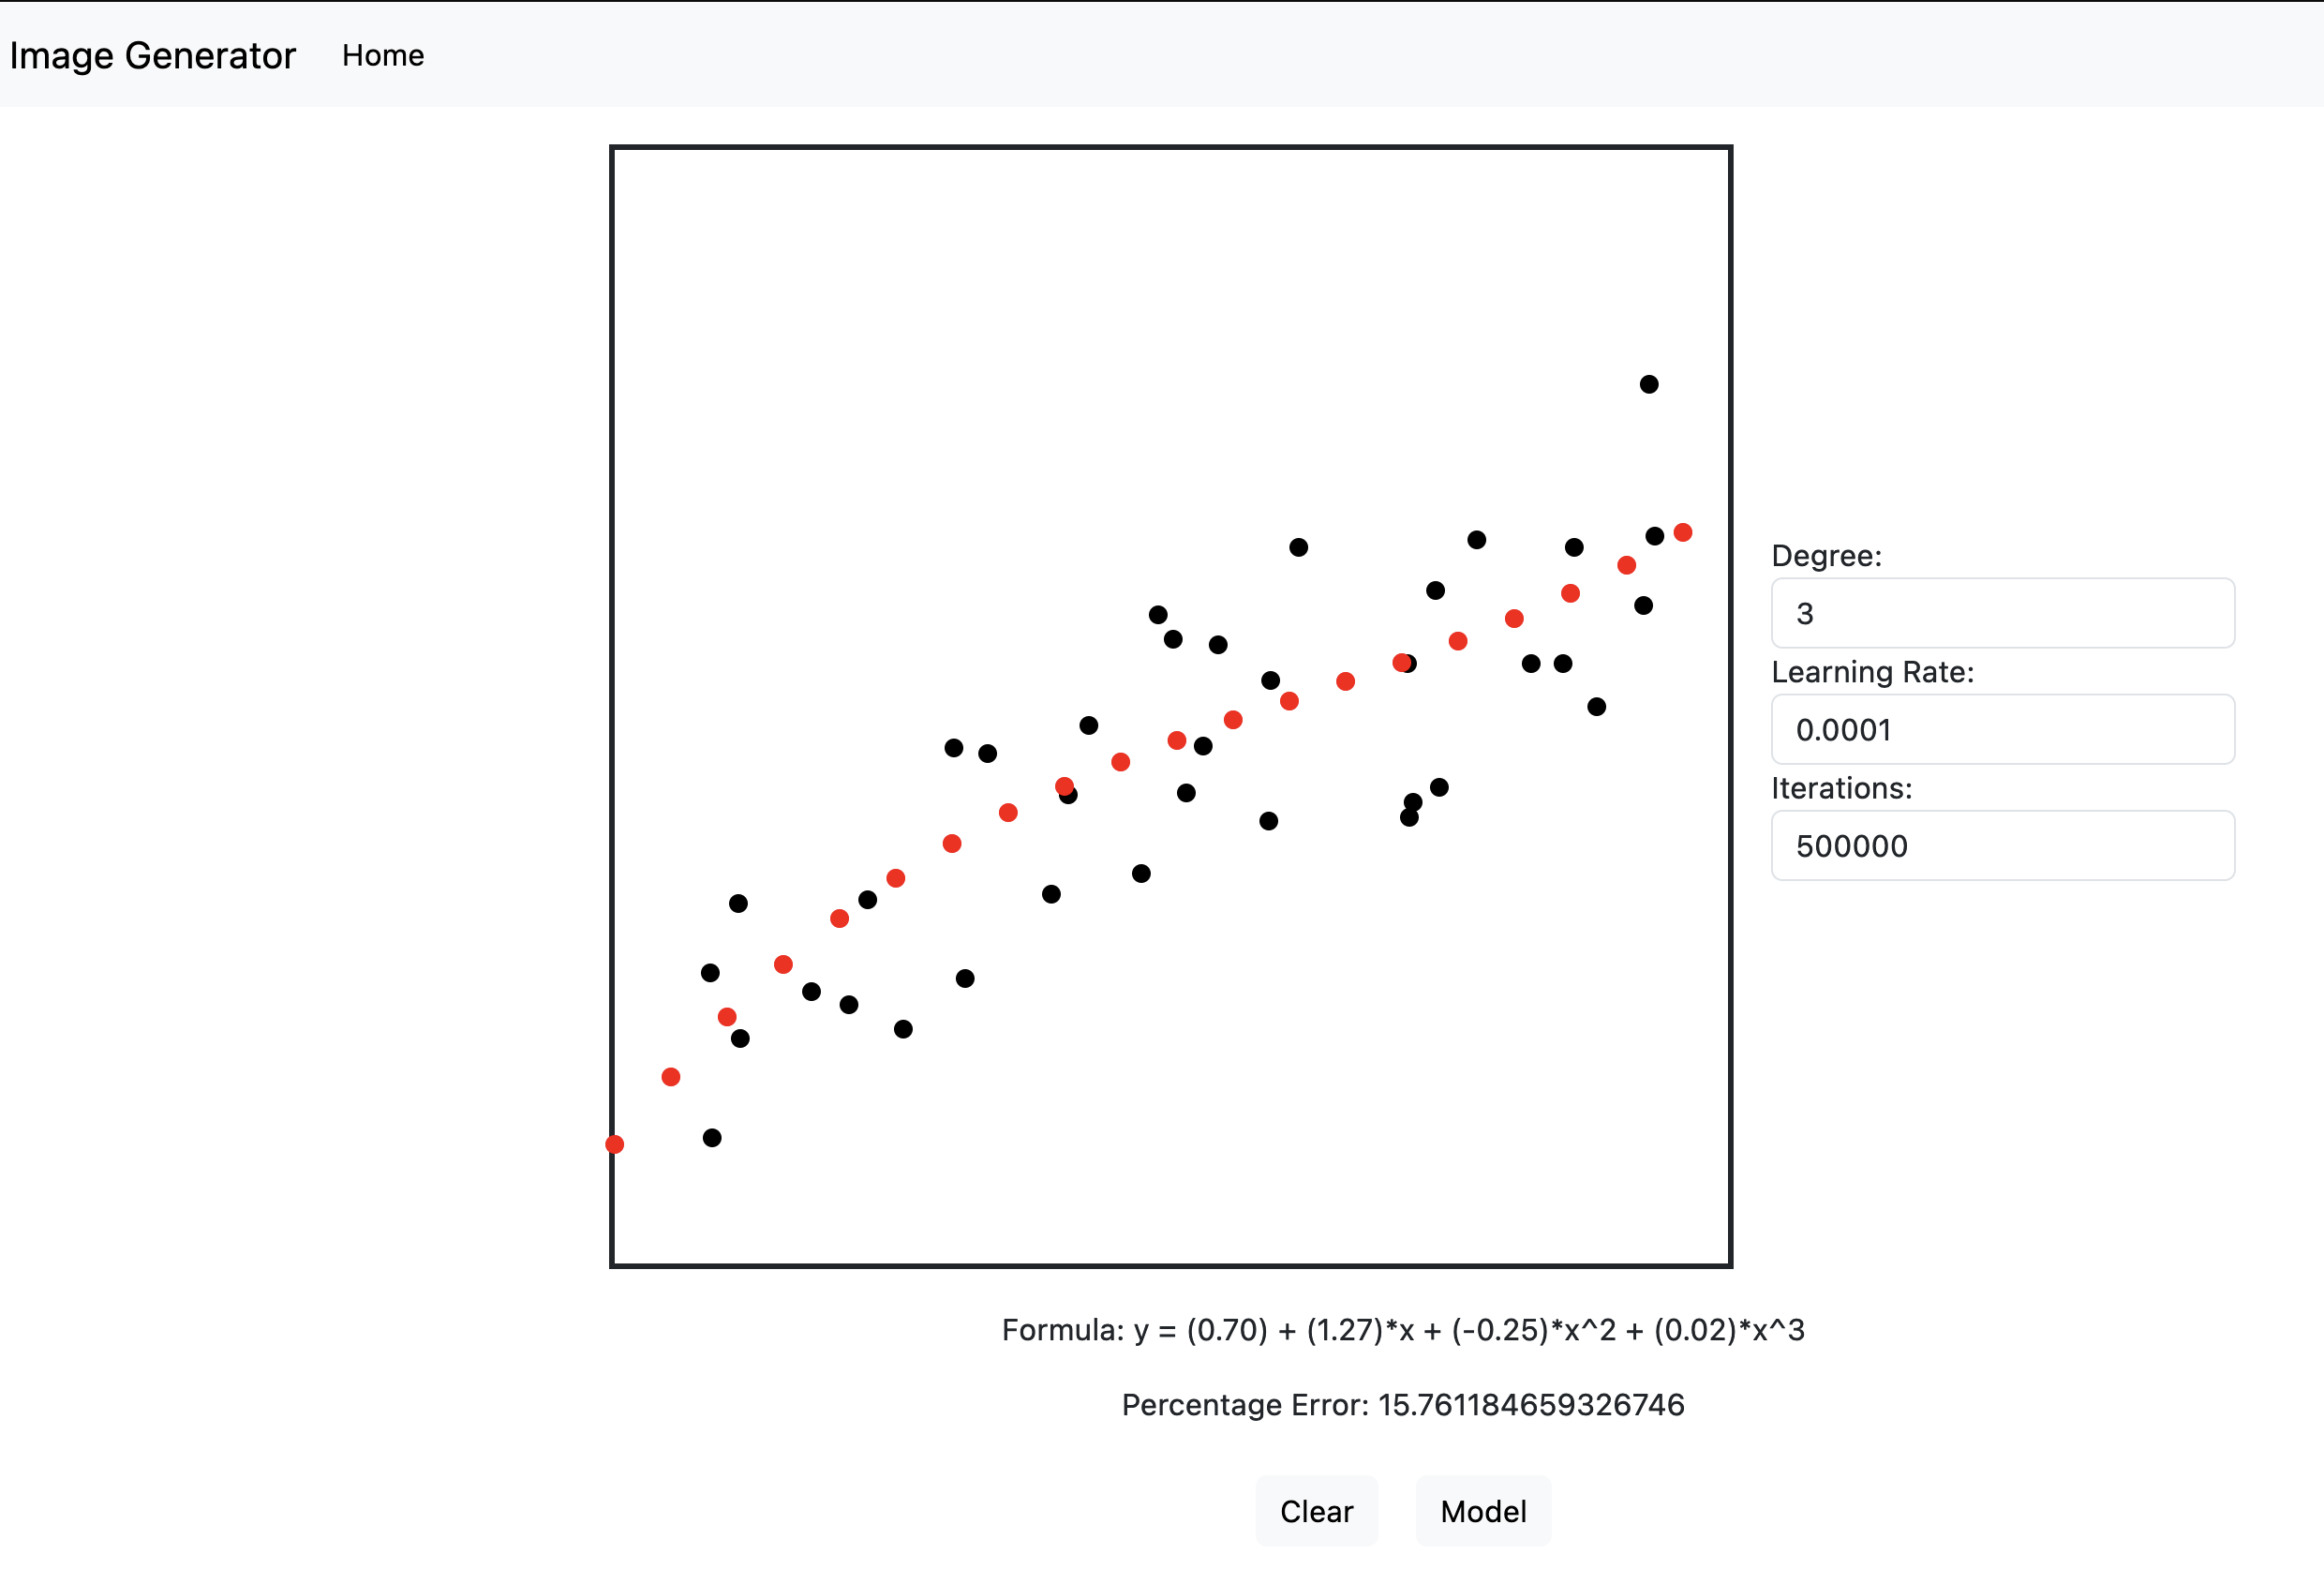
The UI works be creating a 600x600px empty canvas that the user can click on. Binding to the on click listener, we draw a point at the click location and record it's x and y values in a list. The more you click, the more x and y points we collect. These points become the input dataset for the model to be trained on. When you click the model button, this array of x and y coordinates gets sent to the backend with a POST request along with the params in the boxes to the right of the canvas. For now, lets ignore these params, but just be aware they are params that can be tweaked to change how the model will run, we will go into them in more detail in the next section.
Building the Model
I am not going to go into very deep detail of how the modelling really works but I will give a high level overview of it. If you want to know more, check out my previous article about this and the original code. The ML technique being used for this system is called Linear Regression using Gradient Descent. To handle curves, we also include a feature engineering step where by we attempt to fit an N-degree polynomial to the data. If you don't know what that means, don't worry about it! The basic idea of this approach is to take guesses at the coefficients of an equation that could approximate the data provided. The code makes a guess, checks for errors, makes another guess, so on so forth. the goal is that by taking small steps, each of which should hopefully decrease the overall error, the system can reach a point where it has minimised the error and come up with it's best fit to the data.
This is where some of the values I talk about in the previous section come in. There isn't really a way of knowing when you have fully minimised the error in the guesses. One simple approach is just to keep looping and taking guesses for a defined number of times. The idea being that the more guesses you make, the better the error becomes. This is what the iterations parameter does. It defines an arbitrary amount of times to perform the loop. It is set to a random high value to try make sure it gets to a minimum, but you can mess with it as much as you want. The other value that is related to this is the learning rate parameter. This is basically setting the size of the steps to take for each guess during a given loop of the algorithm. The goal is for this to be a small value so that we can incrementally creep up on the ideal minimum. There is a lot of nuance with how it works, but basically this needs to be an arbitrarily small number to reach a minimum. The reason these two parameters are left on the UI is that depending on your dataset you may get an error where the system failed to create a model. It's possible that you might need to play with the step sizes or number of iterations to get a valid result. In real world ML systems, tweaking these values is called hyperparameter tuning and it is an entire topic in it's own right.
As a final note on the modelling, lets talk about how we are fitting a curve
to the data. It might seem strange that something called Linear Regression can
be used to fit a curve to something, however if you look into the maths it
becomes obvious why. I'm not going to go into the maths here but the basic
idea behind this is to use feature engineering to artificially create an input
that is a curve which we will then try to fit. In our case, our input data is
simple a set of x values and our outputs are y values. On their own, this will
form an equation like this y = a*x + c (the equation of a line).
However, what if we take this input data (values of x) and create a new
equation involving higher orders of x. For example, if we wanted to fit a
quadratic curve to this (y = a*x^2 + b*x + c), we could do this
by change our input data to not just be a list of x values but also contain
x^2 values be squaring each input and including it as a separate input in the
dataset. If you are familiar with the linear algebra that is used in this type
of system, we are basically adding a new column to the input matrix which
includes the x^2 terms. Our system will accept this and will spit out values
which effectively map a quadratic to the dataset. The amazing thing about
this, is it continues to work for any high power of x. Hence the input box for
the degree in the UI. This sets the degree of the polynomial you want to fit
and in theory scales infinitely (in practice it only really works well up to
about 5 or 6 as after this the values start to explode in size and it doesn't
work well). the best curves I have found to fit are either 3rd or 4th order
polynomials.
Generating the G-Code
The final step we are going to cover here is how we turned our output points into the arrow pattern and then how we turned this into G-Code that the CNC can understand. For the uninitiated, G-Code of NC code is the set of instructions that a CNC machine interprets to execute it's job. There are different flavours of G-Code which differ between machine firmware and manufacturers but the basics are most the same for most machines. My DIY CNC machine uses the GRBL firmware, so it is this flavour of G-Code we are implementing here.
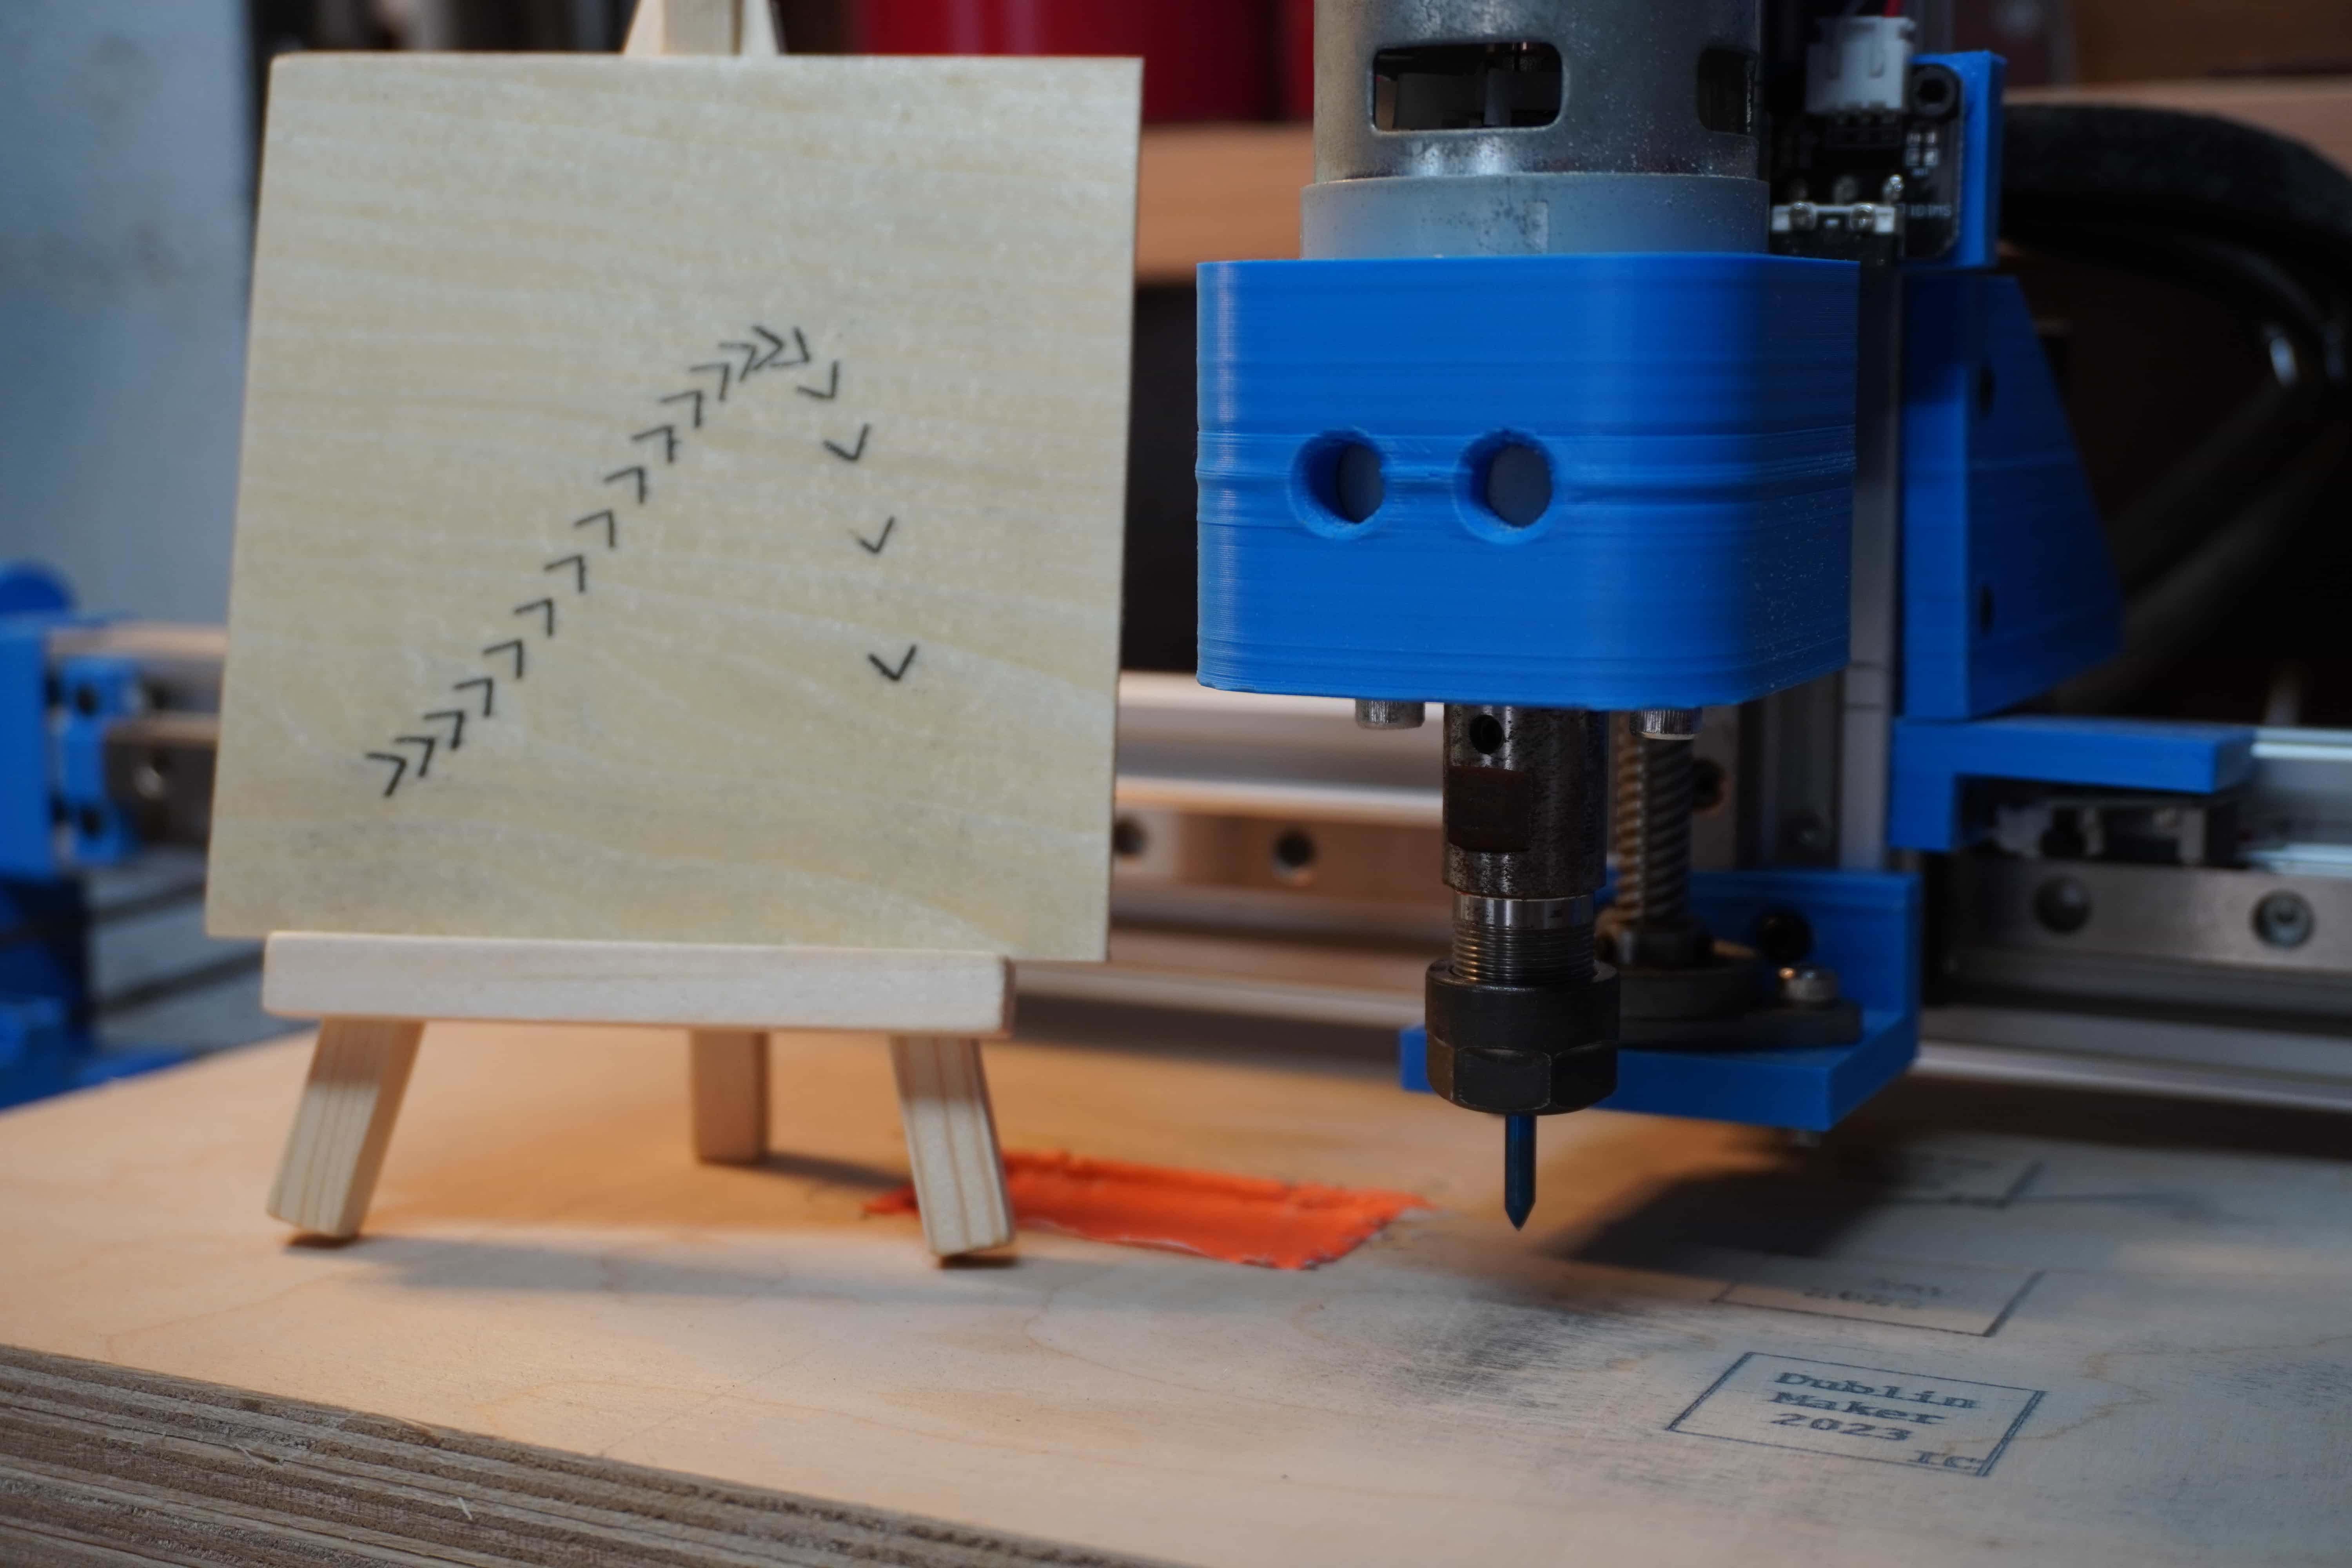
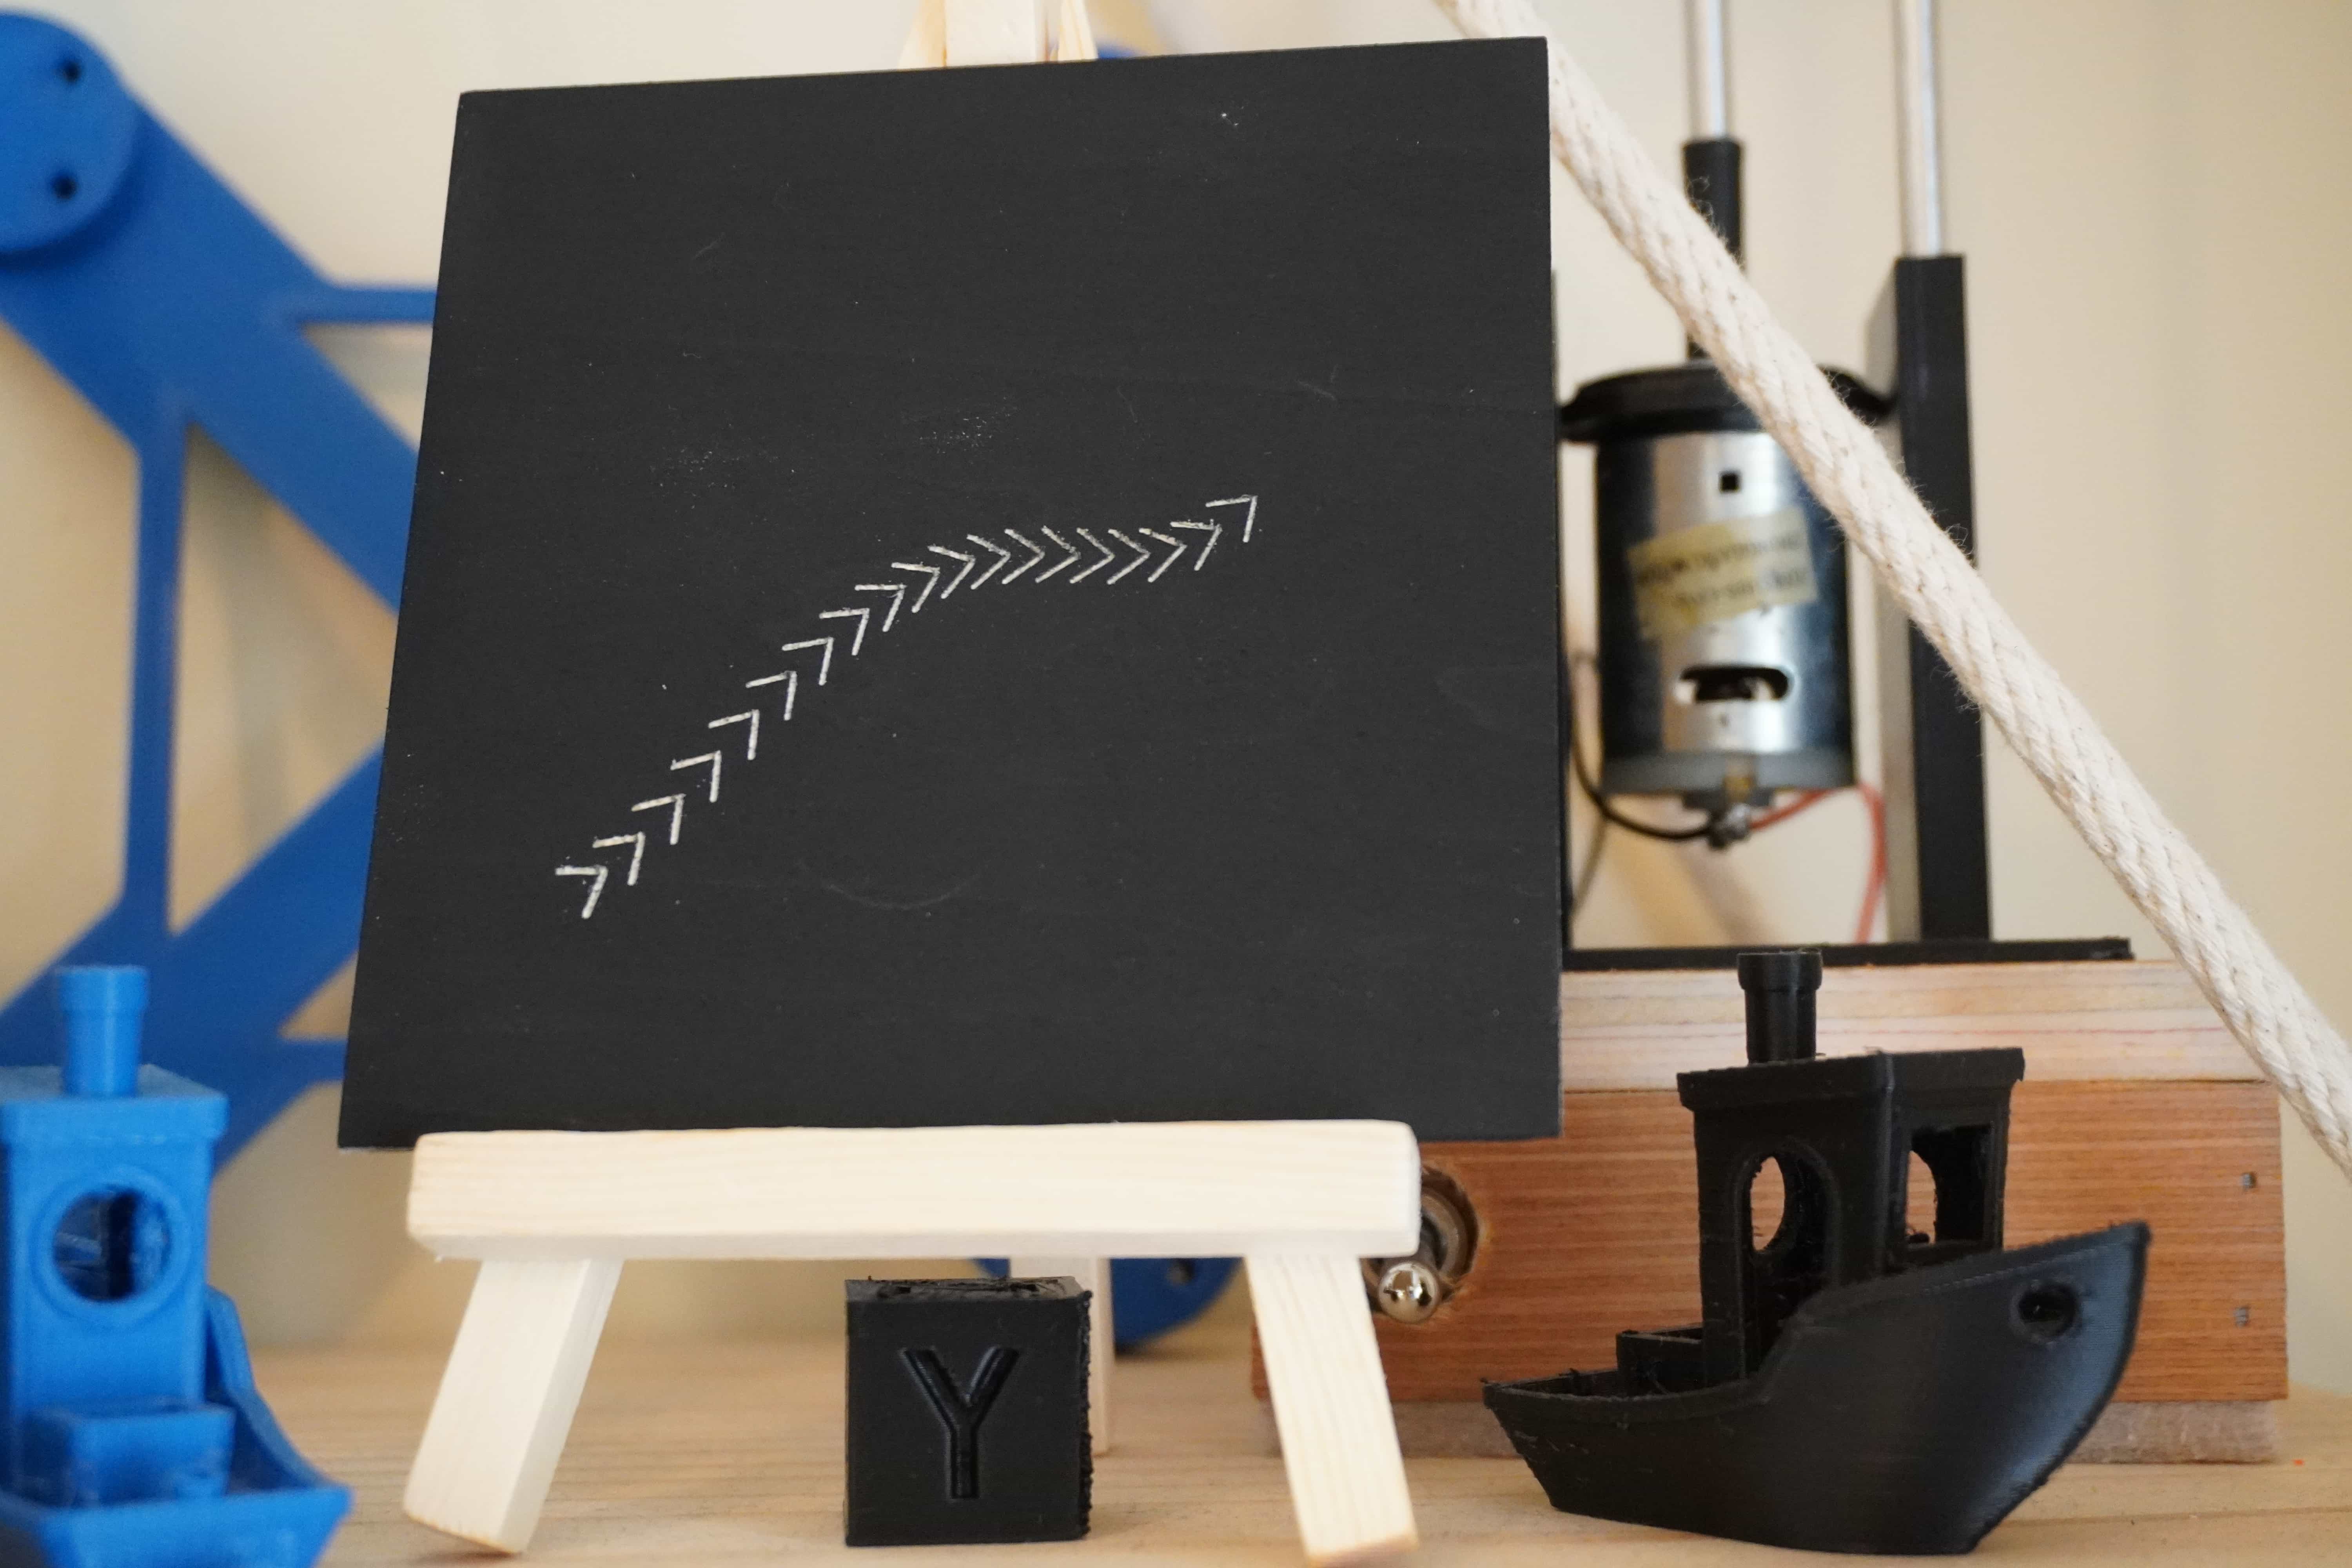
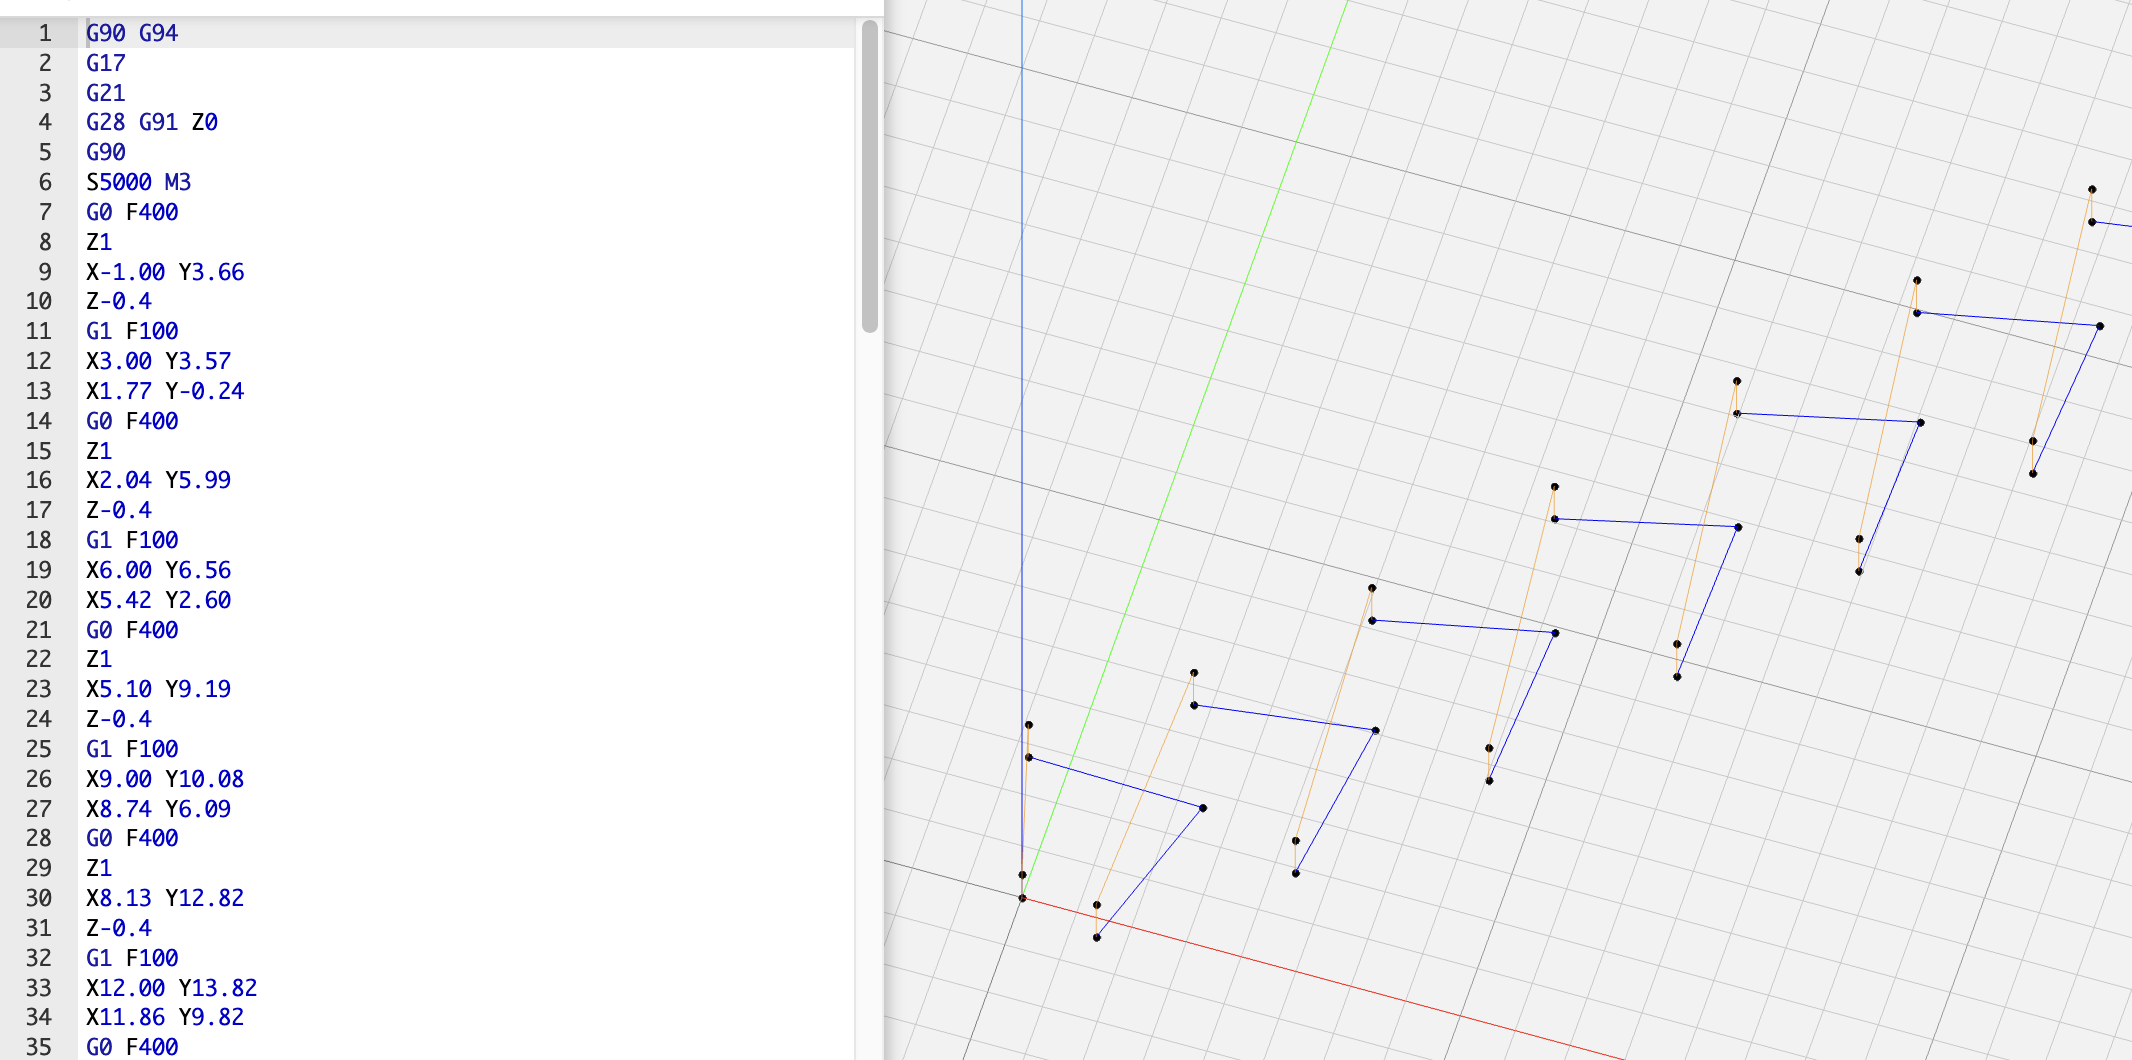
Let's look at the pattern we want to create. Looking at the output of the model, we can effectively generate an equation which governs the curve we see in the output plot. The output data points we see are a sample of the continuous function which gives us these discrete points. My goal was to take these discrete points and do something with them to create a funky image. In theory you could do anything, but I wanted to satisfy two constrains, I didn't want the maths to generate them to be very complicated to develop or implement and I also wanted to make sure the CNC machine could easily draw the shapes. To this end I settled on drawing straight lines as this would only require single lines of G-Code for each move requiring only that I set a start point and provided the finish coordinates in the G-Code command.
With this idea of straight lines in mind, I thought about what if each point formed an arrow that sort of pointed into the next one, so that moving from point to point was kind of like directions pointing where you need to go next or rather pointing where you came from. The maths for this is relatively simple, given to known points from the output dataset, I would need to compute two more coordinate points which would effectively become the end points of the arrow. The data set point would be the coordinate of the tip of the arrow. You can see below we only need to use some simple trigonometry to compute the points.
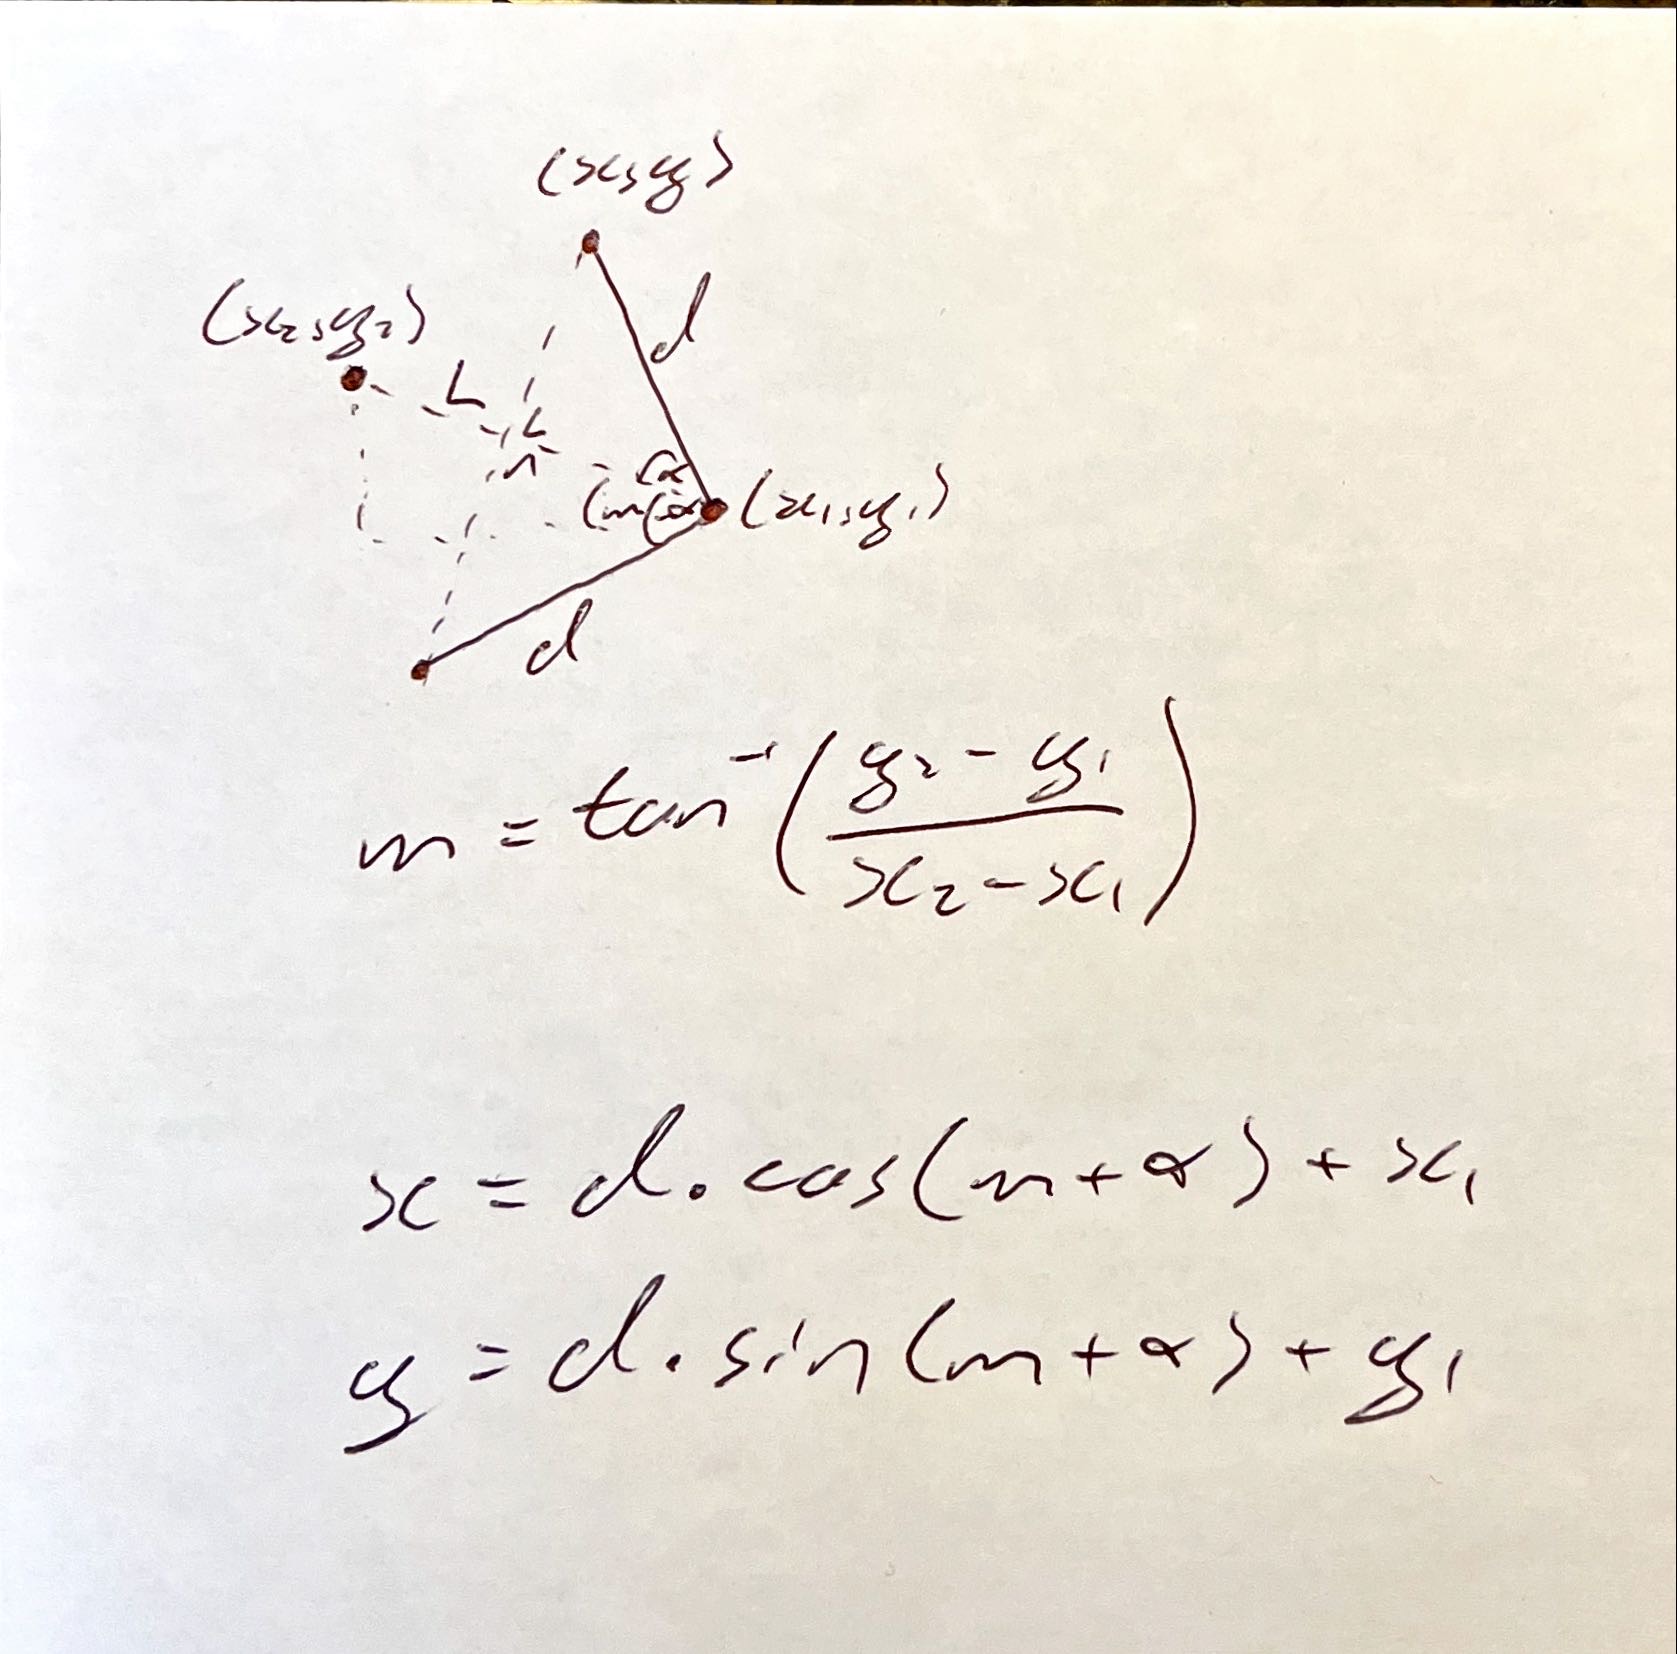
The equations above will solve for the upper x and y values for the top point of the arrow, the lower points are the exact same because of the symmetry but in the maths you do minus alpha for the offset of the slope angle m. There are a couple of unknowns here in the equations, we have the length of the side of each arrow d and the angle of the tip of the arrow alpha. We can set these to whatever we want. In this case I played around with the scaling of things until I found values I liked, but these could be set to anything really to make a slightly different pattern.
The final step is to generate the G-Code for this path. The basic idea is to move from the origin of the graph, move up in the air and over to the top edge of the first arrow point. From here we should move down to our engraving depth, move to the tip of the arrow, then to the other end point and then lift up into the air. From here, the steps repeat until we have exhausted all of the points. Now, G-Code does not support any kind of loops etc, it simply executes each movement with a single line of code. In this way, our code needs to loop through all of our calculated points and generate the instruction set for each move. I'm not particularly proud of the code I wrote to do this, but it does the job! You can see what the path should look like below.
What's Next?
The next steps with this will possibly be to make it a little more streamlined. I'd love to possible integrate it into a single control panel connected to the CNC. I have an idea to try and build an enclosure for the machine which would allow it to be safely run a maker fairs etc. The goal would be to have a user interact with a simple UI and walk away with their own fully unique piece. That is going to be a lot of work but it's something I'd like to do in the future. For now, this is a proof of concept for something similar.
Keep on making - IanIf you enjoyed reading this article and would like to help funding future content, please consider supporting my work on Patreon.