Go ML - Vol 1
25th Feb 2021
Go Machine Learning Linear RegressionI recently completed Andrew Ng's fantastic Machine Learning Course on Coursera (I have proof see!!😬). If you haven't heard of the course, it's absolutely fantastic. It is an excellent introduction to the topic for anyone with a basic background in maths and programming. I have a fairly deep background in maths and numerical programming from my day job and studying electronic engineering, but this really isn't a prerequisite. In any case, I learned a lot and I've been trying to think of a small project to play with some of what I learned.
Another thing I've been wanting to play with for a long time is Go. If you don't know, Go is an open source programming language originally created at Google. Go is known for being a very preformat language and there just so happens to be a great linear algebra library for it.
These two things combined made up my mind that I was going to attempt to implement some ML in Go. I decided to create a command line tool to perform some basic ML tasks. Starting with what I figured would be the easiest thing to implement; I build out a tool to perform linear regression on a dataset provided via a CSV file.
The TL;DR
I built a command line tool in Go that can perform linear regression on a dataset provided as a CSV file. It works, but there is more to do!
You can find it here on GitHub if you want to check it out.
NOTE: I AM NEITHER AN EXPERT IN GO NOR ML, SO THIS MIGHT ALL BE GARBAGE
Why?
So... Command line utility, linear regression... lol, wut? Why? Good question! Firstly, let's talk about the machine learning concept I am applying in the V1 of this. Linear regression is more or less the simplest ML technique you can build out. If I am going to build out the end to end of an ML tool, I might as well start with the simplest technique.
In terms of why build it as a command line tool? I find cli's to be some of the most useful tools I have on a day to day basis. I tend to live in the command prompt day to day and I find command line tools perfect for testing things in a quick and dirty fashion.
The vision for this tool is pretty simple; pull some data from somewhere, stick it into a CSV file, run a linear regression on the data, see if I can fit a simple model with decent performance, output some visualization data. If I can do all this without really leaving the command prompt, that is a win! The plan is also to implement a few other ML techniques such as logistic regression and k-means clustering, but that will come in the future.
This is also a great opportunity to learn about application architecture in Go including the flags package which makes passing params and setting up a command line tool really easy!
ML Basics: Linear Regression
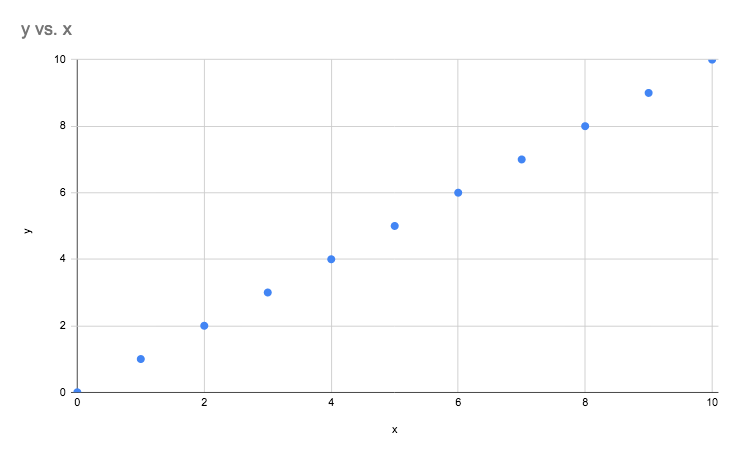
Linear regression is at it's core a very simple concept. Consider the below graph, incase it's not obvious, it's a
straight line! In mathematics, this relationship between an input x and an output y is
defined by the following formula y = m.x + c. In this formula, m defines the angle that the
line makes with
the x axis and c controls the height that the line is above the x axis. In the
below example, the line is at a 45
degree angle, making m = 1 and there is no offset from the x axis, making c = 0
The above example is contrived, however, in many physical systems linear approximations to data can be
extremely effective for making reasonably accurate predictions. In the above example, we plotted out the data based
on a formula where we could pick the values for the parameters m and c. We could make these
what ever we want, but that isn't really very useful in the real world. Random lines drawn on graphs might be
satisfying, but are probably not useful.
In the real world, we are more likely to have some data collected in relation to something (anything, I dunno, use your imagination). One of the first things we might do is plot the data like we did above to see if we can find any trends in it. Let's take a look at our imaginary dataset plotted below.
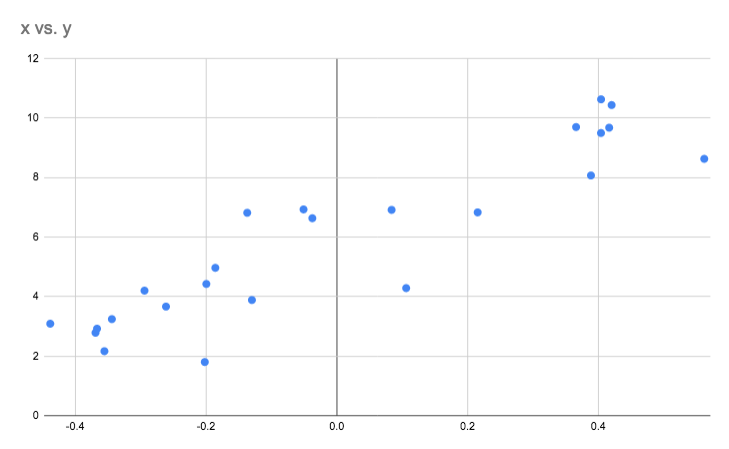
With the data we collected, we would like to know, for any given input x what value of y
might
be reasonable to expect. However, as you can see above, we just have a few clusters of points. We can sort of tell
what direction the trend line
will go but we
don't know exactly where to draw it. That is, we don't know what are the best values of m and
c to pick here.
What we seek to do with linear regression is find a set of parameters m and
c that draws the best fit straight line to this data. That is, the line that overall has the least error
considering all of the real data points we have. In other words, for any given input x, the
actual output y should have a fairly high probability of sitting close to or on the line we draw.
The way this is done in the tool I have written is with a technique called gradient descent. I won't go into the details of the mathematics behind this concept but you can think of it in the following way. The gradient descent algorithm essentially takes an initial guess at the best parameters to fit to the straight line. From here, it checks the error on each piece of data we have and works out an overall "cost" (usually the sum of the squared errors) for this particular set of parameters. Now the algorithm decides to change the value of the parameters slightly and repeats the process. The algorithm will continue to do this in a loop until it is told to stop or some minimum error is found. At this point we will have the parameters for some straight line that should roughly match the data. With this information we can plug inputs into our earlier formula for the equation of a line and get predictions.
I put the above data into my command line tool and generated the following prediction, it happens to have approximately 20% error. Interestingly, by looking at the vertical distance between the red and blue dots, you can see a visual representation of the error.
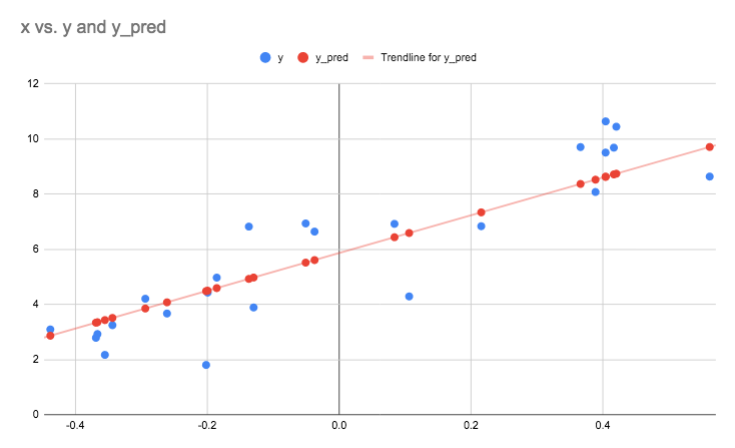
This isn't an amazing accuracy, but if you look at the data, you can see that it doesn't really lend itself to being approximated very accurately by a straight line. With some slight conceptual tweaks we can implement something that can let us fit other shapes to the data that might fit better and give less error. Interestingly, this technique uses basically all of the same code as was used to do this prediction. However, we are going to leave that for another article!
What's Next?
So my command line tool can pretty much only do one thing right now, perform linear regression. Linear regression is only useful for predicting continuous values based on inputs. However, the basics of linear regression can be used to build a basic type of classifier called a logic regression classifier (think of a system that can tell pictures of cats and dogs apart!). I plan to make this my next feature to implement. I am also toying with the idea of adding visualizations to the tool and maybe providing some tooling for tuning the performance of a model (you currently can do this, but it is very manual).
Given that I'm not an expert in Go, I also plan to do some refactoring on the implementation to see if I can improve efficiency and memory use. I also don't really know if the Go code I wrote is very idiomatic of the language, so I want to spend some more time digging into the best ways to do things in the language. Feel free to look at the code above and see if you think it's decent Go code or not (I'm assuming it isn't). Also, feel free to tell me, I won't get offended, this was all written as a means to an end, think of it as more hacked together to get a job done than thoughtfully architected.
In the next set of articles on this topic I'm going to go into some more depth on multivariate linear regression, mean normalization and hyperparameter tuning. I will dig into these topics and how they are implemented in the tool. Aside from talking about the machine learning concepts involved in the tool, I will also talk about some specifics about using Go for this type of thing and some advantages and disadvantages.
Keep on learning - IanIf you enjoyed reading this article and would like to help funding future content, please consider supporting my work on Patreon.